July 2023 San Mateo County Market Update
In this market update, we are sharing a comparison with Q2 2023 and Q1 2023 to show changes in the market over this year. Read below to see the data and our analysis of what’s happened so far in the 2023 Baya Area Real Estate Market.
Median Price vs Appreciation 2023
There are many in the media and even economists who confuse median home price with appreciation. Median price measures the middle-priced homes that were sold, while appreciation measures actual gains or decreases in the value of homes.
The median home price can be influenced heavily by the mix of sales – Let’s look at an example. Let’s say in 2022 there were 5 homes that sold, $200k, $250k, $300k, $350k, and $400k. The median sale price would be the middle number or 300k. In 2022, we saw a 6% appreciation, which means all of those homes increased in value to the following in 2023: $212k, $265k, $318k, $371K, and $424k, respectively.
However, in our example, let’s say that in 2023, only the first three homes sold, or the $212k, $265k, and $318k priced homes. This is a real-world example driven by higher rates, lack of inventory, and other factors that saw more homes on the lower end sold vs homes on the higher end sold.
As a result of this, the median price is now $265k, and when compared to 2022, the median price is down 13%. However, all the homes are higher in price end appreciated by 6%. This is an example to show you how median price can be misleading and not measure true appreciation.
The market dynamics are such that buyer’s affordability has decreased, and demand for homes on the lower-priced end of the market has increased. We have seen over the last several months the median sales price of condos and townhomes have increased, driven in part by demand for homes on the lower-priced end of the market.
Mid-Year Review: Q2 2023 vs Q1 2023
As we reach the middle of the year, now is a good time to look back over the first half of the year. Below we are sharing some key data points as well as providing an explanation of what this means for our local San Mateo County real estate market. This data is focused on single-family home sales in San Mateo County for the period of January 2023 – June 2023.
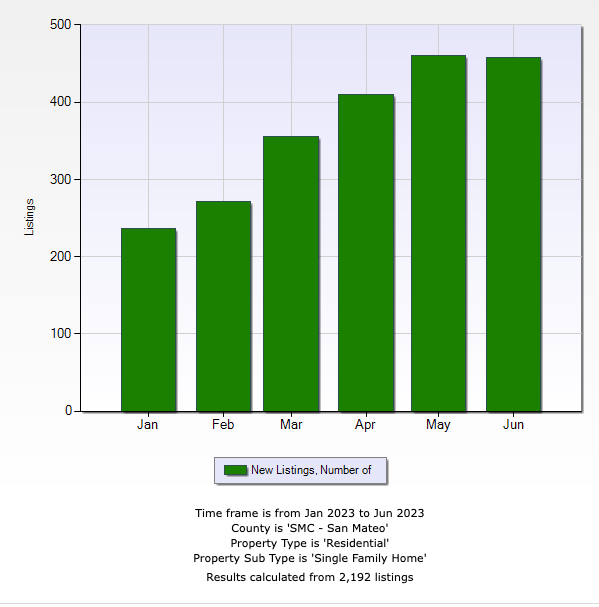
Number of New Listings
We saw the number of new listings coming to market steadily trending upwards from January through June. May saw slightly higher new listings coming to market than June. Typical seasonality for our market peaks in April or May, and while this year followed that trend we did continue to see more new listings than expected coming to market in June as well.
Comparing the two quarters, in Quarter 1 (January – March) we saw 863 new listings come to market compared with Quarter 2 (April – June) we saw 1,329 new listings, considerably more inventory, come to market.
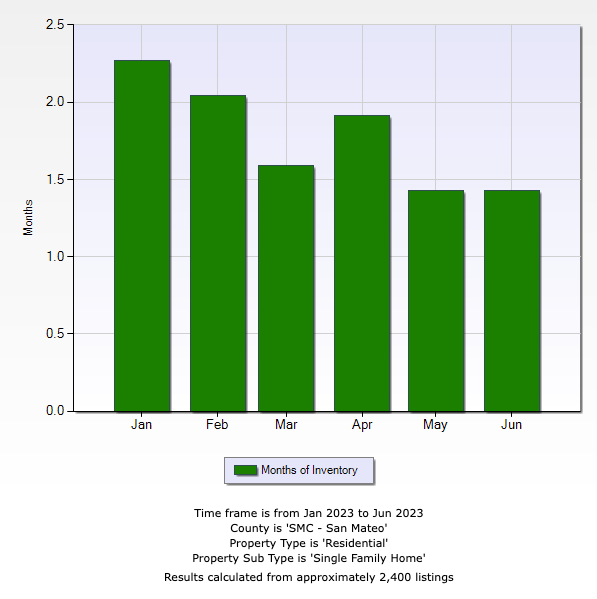
Comparing the Number of Sales with Months of Inventory
Though few new homes entered the market in January 2023, there was inventory remaining on the market from 2022. As you might expect, this increased our months of inventory – an important marker that showed the balance of the market. While this varies by market, in San Mateo County, more than 4 months of inventory begins to edge into a “buyers” market. In January 2023, we saw 2.3 months of inventory, which is a typical amount of inventory for January in our market.
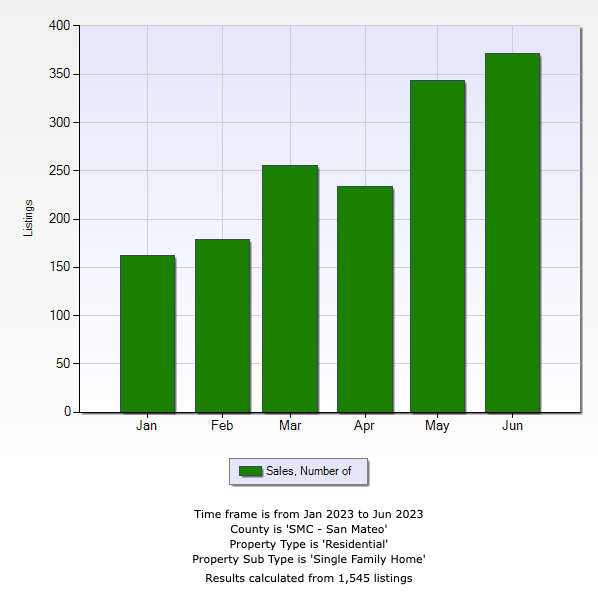
Starting in February we began to see sales pick up, dipping slightly in April. According to the California Association of REALTORS, “a surge in mortgage interest rates and a shortage of homes for sale suppressed California home sales in April, while the statewide median home price climbed above the $800,000 level for the first time in six months.” However, by May, an interest rate reprieve boosts California home sales to the highest level in eight months! That momentum carried on into June.
Comparing the first and second quarters of 2023, in Quarter 1 our market had an average of 2 months of inventory and saw 596 sales, but in Quarter 2 our market had an average of 1.6 months of inventory and saw 949 sales.
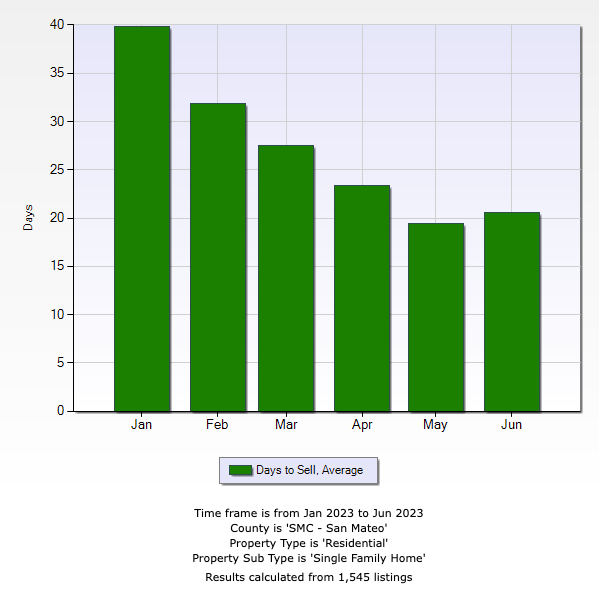
Average Days on Market
Moving into the year, as more inventory became available the market started to heat up. You can see in the chart above the average days on the market dropped steadily. Even as inventory continued to come to market, it was quickly absorbed.
Comparing the first and second quarters of 2023, in Quarter 1 homes were on the market for an average of 33 days, but in Quarter 2 homes were on the market for an average of 21 days.
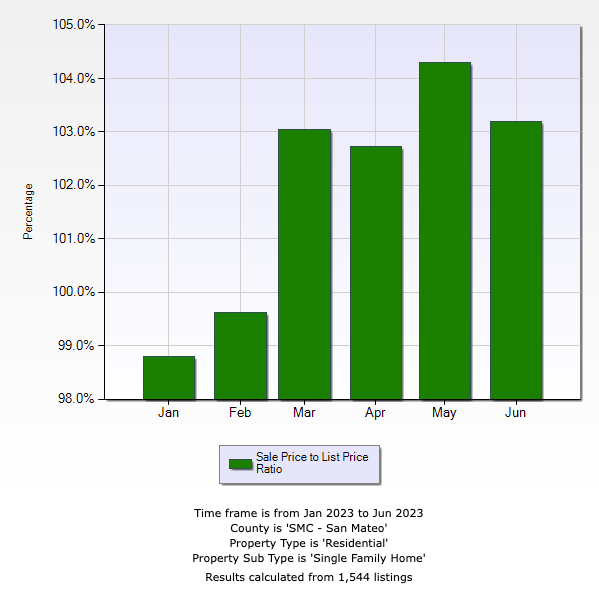
Sales Price to List Price Ratio
Right in line with the other market factors, as market activity increased so did “overbids” or the amount received when comparing the sales price to the list price.
Comparing the first and second quarters of 2023, in Quarter 1 the average overbid was 100.5%, but in Quarter 2 the average overbid was 103.4%.
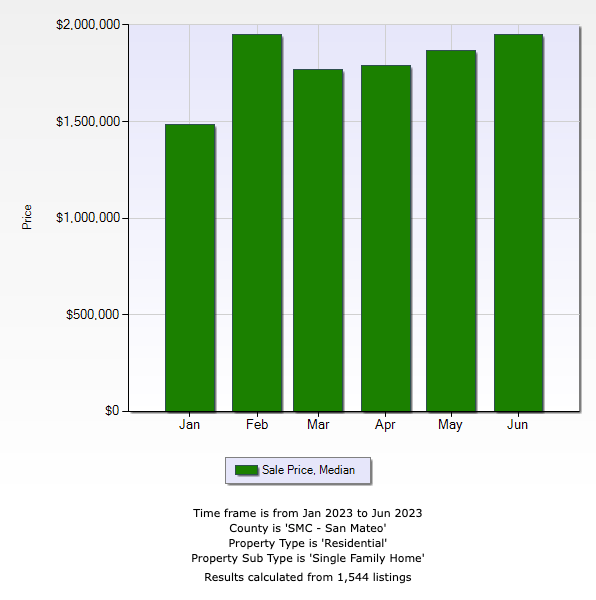
Above is the Median Sales Price for Single Family Homes for the period of January 2023 – June 2023.
For Quarter 1, we saw a steady rise in Median Sales Prices. During this quarter, the median sales price for single-family homes was $1,767,250. In Quarter 2, the trend continued with the median sales price for single-family homes at $1,790,000.
Our predictions for the remainder of 2023
While no one has a crystal ball, we do have some indicators as well as historical data to understand what might happen in the last half of 2023.
Interest Rates – Interest rates are a huge impact on the market. Most buyers have adjusted, and as long as they stay fairly steady, we believe that activity will continue to accelerate.
Inventory – While we do believe more inventory will become available by the end of July and early August, based on conversations with our peers, new listings will continue to trend in line with similar levels as last year, as high mortgage refinance rates discourage anyone from moving and selling. That will ensure home prices either rise or are resistant to any decline.
Effect on Buyers – Affordability for first-time buyers will continue a downward path as rates stay higher than in recent years and prices continue to edge up.
Pricing and Preparation – As always, the pricing strategy and how a property is prepared for the market will set the stage for how it’s positioned. If you’re considering selling your home, working with an agent who has a proven track record will be key to your success!
Overall, we expect to see a healthy market. While the market is absorbing homes priced at the $2.5M price point and below quickly, there is greater demand for higher-priced homes and even less available inventory. This limited inventory and high demand in all segments will skew more in the seller’s favor.
Need expert guidance on our local real estate market?