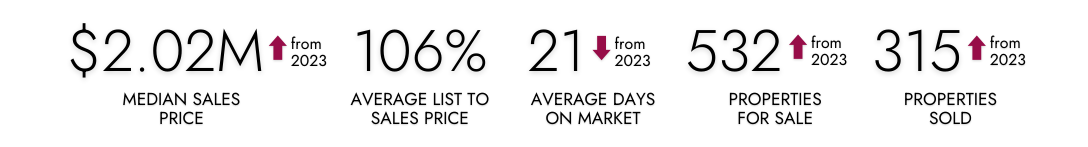
San Mateo County Market Update August 2024
If you received our postcard, you may have noticed that the arrows indicating year-over-year changes from 2023 were accidentally omitted during the printing process. We regret any inconvenience this may have caused. Please refer to the versions below for year-over-year comparisons.
For a deeper dive into our mid-year market update, explore the expanded report below.
What Every Homeowner Should Know About Their Equity
Curious about selling your home? Understanding how much equity you have is the first step to unlocking what you can afford when you move. And since home prices rose so much over the past few years, most people have much more equity than they may realize.
Here’s a deeper look at what you need to know if you’re ready to cash in on your investment and put your equity toward your next home.
Home Equity: What Is It and How Much Do You Have?
Home equity is the difference between how much your house is worth and how much you still owe on your mortgage. For example, if your house is worth $400,000 and you only owe $200,000 on your mortgage, your equity would be $200,000.
Recent data from the Census and ATTOM shows Americans have significant equity right now. In fact, more than two out of three homeowners have either completely paid off their mortgages (shown in pink in the chart below) or have at least 50% equity in their homes (shown in red in the chart below)
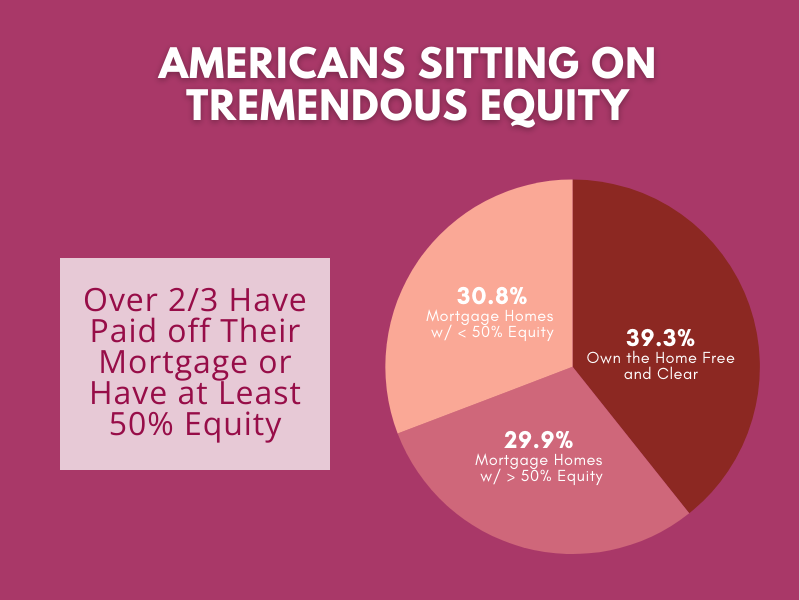
Today, more homeowners are getting a larger return on their homeownership investments when they sell. And if you have that much equity, it can be a powerful force to fuel your next move.
What You Should Do Next?
If you’re thinking about selling your house, it’s important to know how much equity you have, as well as what that means for your home sale and your potential earnings. The best way to get a clear picture is to work with your agent, while also talking to a tax professional or financial advisor. A team of experts can help you understand your specific situation and guide you forward.
Home prices have gone up, which means your equity probably has too. Connect with Rumana so you can find out how much equity you have in your home and move forward confidently when you sell.
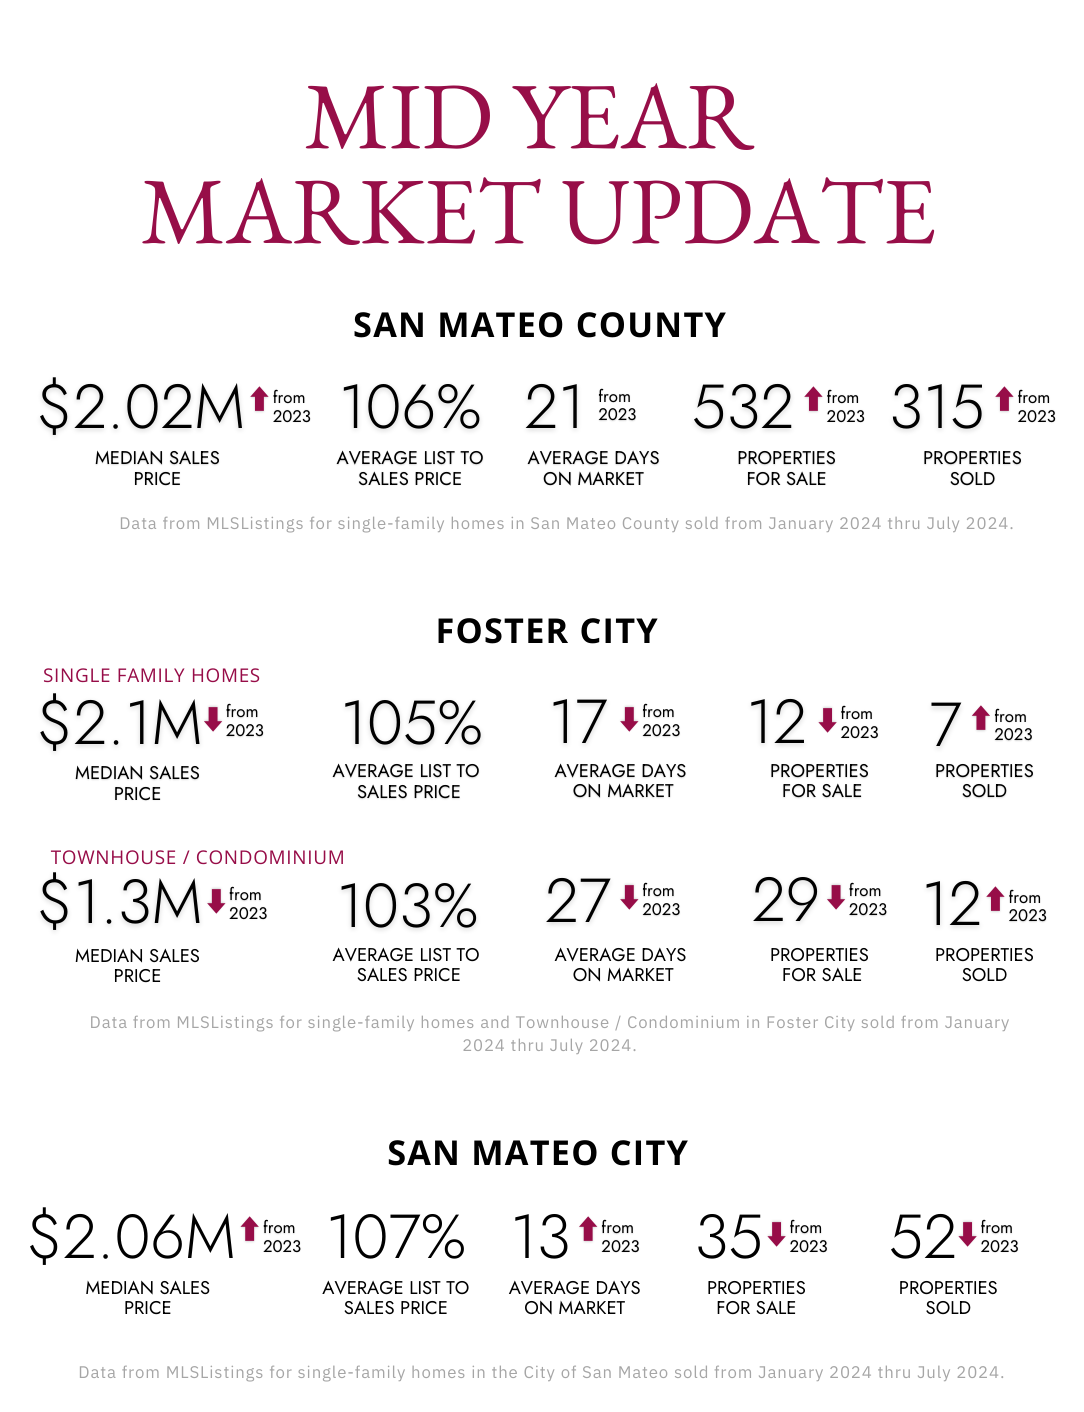
Mid Year Update
July 2024 Market Reports
If you receive our postcards, below you'll find market information for San Mateo County, San Mateo (City), and Foster City.

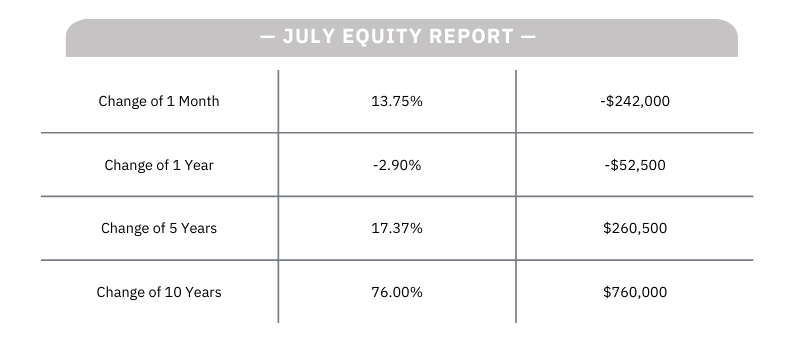
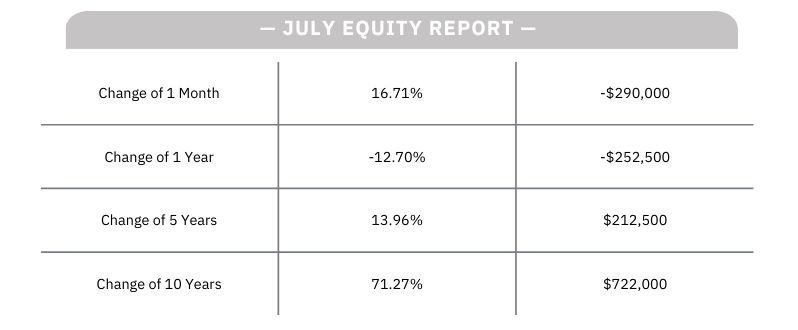
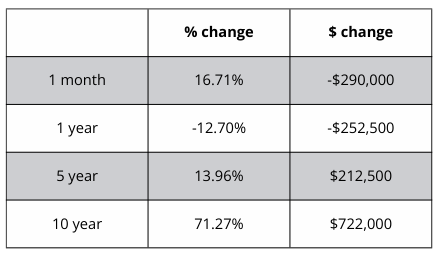
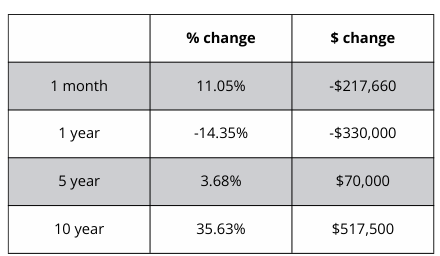
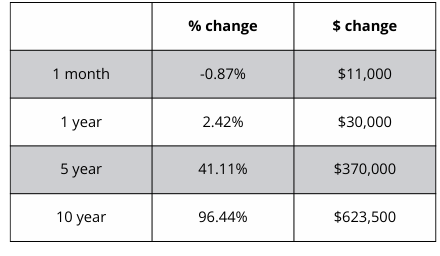
San Mateo County Equity Report. This report covers changes in median home sales prices over the last month, year, five years, and ten years.
Market Mid Year Report. This data is from MLSListings for single-family homes in San Mateo County sold from January 2024 thru July 2024.
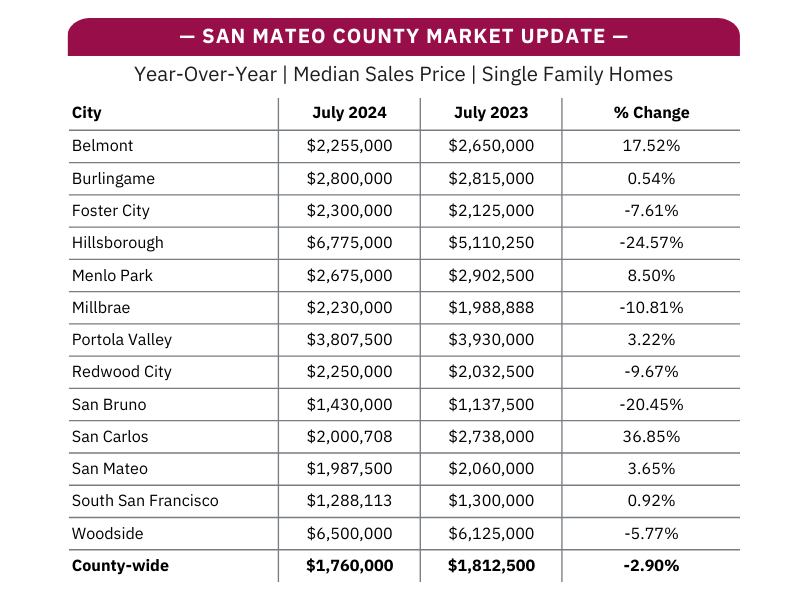
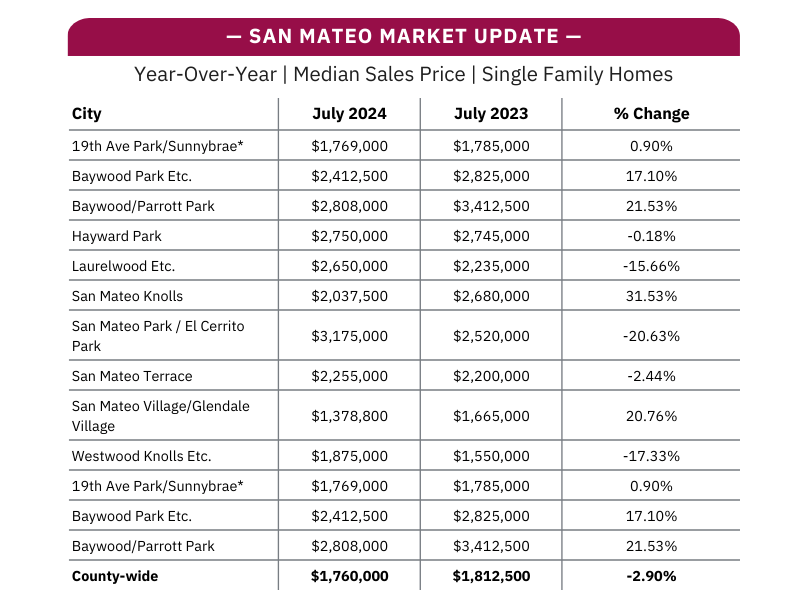
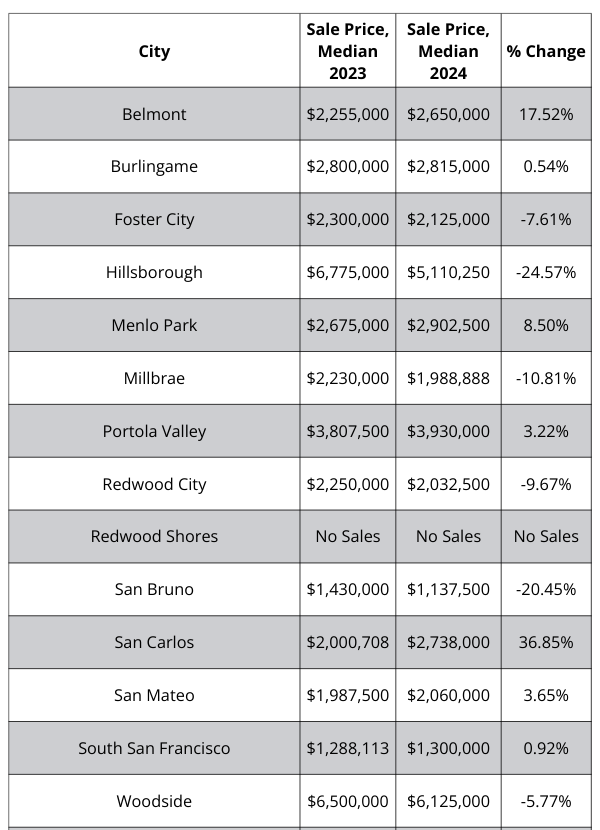
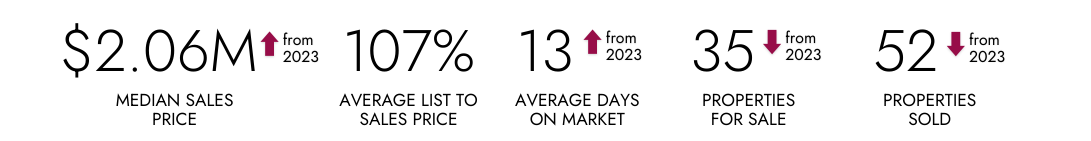
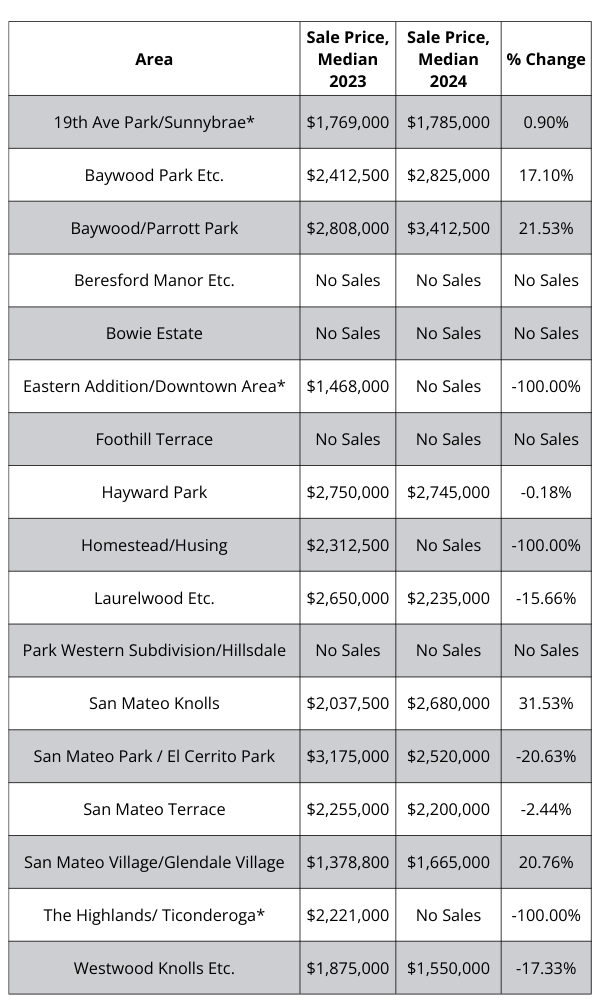
San Mateo County Market Report. This report covers changes in median home sales prices, year over year.
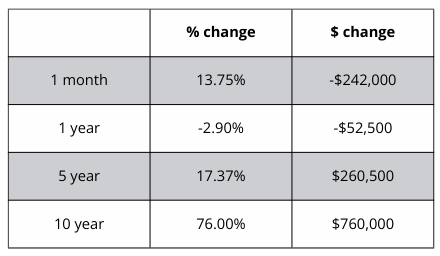
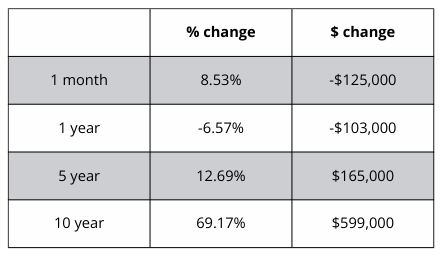
San Mateo City Equity Report. This report covers changes in median home sales prices over the last month, year, five years, and ten years.
Market Mid Year Report. This data is from MLS Listings for single-family homes in the City of San Mateo sold from January 2024 thru July 2024.
San Mateo City Market Report. This report covers changes in median home sales prices, year over year.

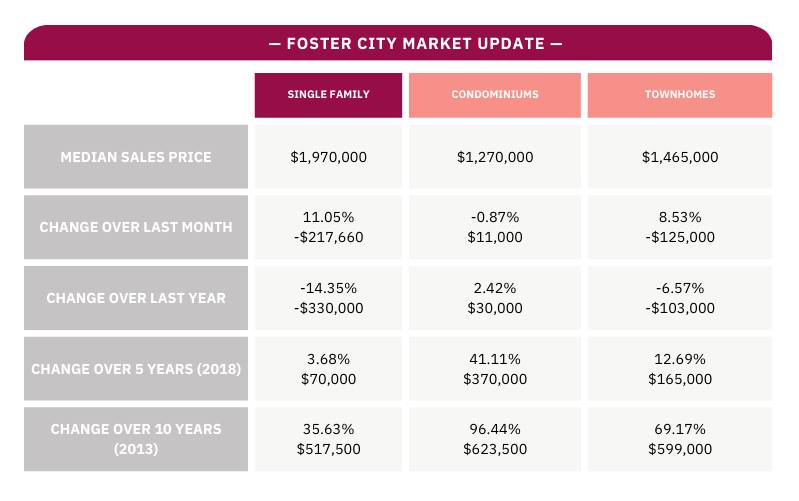
Foster City Equity Report. This report covers changes in median home sales prices over the last month, year, five years, and ten years.
Market Mid Year Report. This data is from MLS Listings for single-family homes and Townhouse / Condominium in Foster City sold from January 2024 thru July 2024.
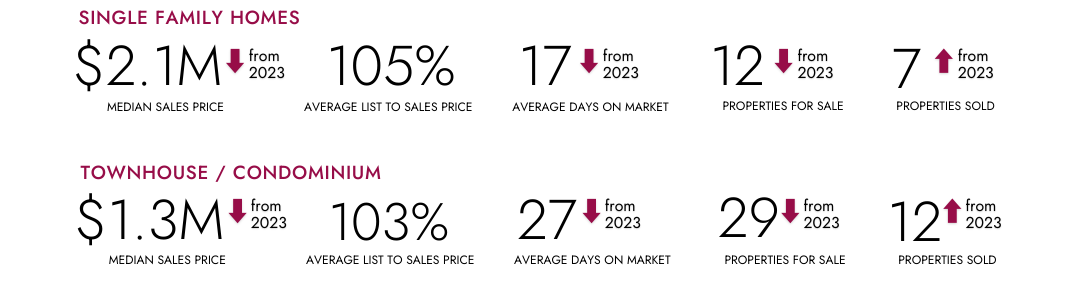
Single Family Residences
Condominiums
Townhomes
Expanded San Mateo County Market Report